Tracking your WordPress website’s activities is the key to understanding your online audience. With competition for customers at an all-time high due to the sheer number of available website options, getting a handle on who your audience is, where they come from, what they need from you, and how to attract even more people just like them is a great way to get ahead of the pack.
Google Analytics is a free and powerful online program that can track traffic patterns on your website. It is easy to set up and offers a multitude of information regarding the happenings on your website on a daily basis.
Rather than just track how many people visit your website daily, Google Analytics provides information that digs deep into exactly what type of people visit your website and how to build you online audience using that information.
The problem is, Google Analytics offers so much information about the traffic on your website it can quickly become overwhelming. Many times people will set the program up and then never actually dive into the features that are available because they simply don’t know how to.
Let’s take a look at some of the main aspects Google Analytics has to offer even the most novice of website owners, and see how they may affect your WordPress website in a positive way.
Reporting Area
Upon setting up and installing Google Analytics onto your WordPress website, you will be directed to the main reporting area. The reporting area is where all of your main reports are located. Divided into separate categories, and offering a myriad of information, it is important to note what each category is and what information it provides.
On the left-hand side of the main reporting page, Google Analytics provides a navigation sidebar from which you gather all the necessary information required to increase your website’s success. There are 8 distinct categories to explore:
1. Dashboards
With Google Analytics, you have access to dozens of pre-made reports with many different metrics regarding your website’s traffic. Dashboards are a collection of widgets that give you an overview of these reports and metrics you care about most, letting you monitor many of your website’s activities at once.
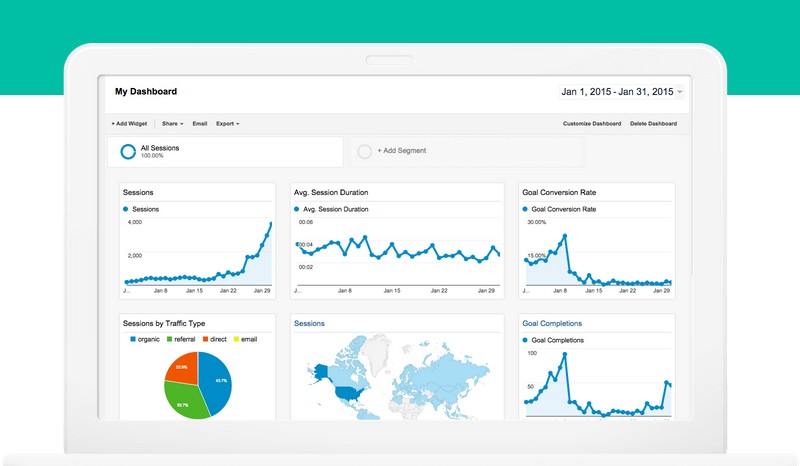
The dashboards section will display general information such as website user numbers, browser information, goal settings, and geographic demographics. This is accessed through Google’s standard starter dashboard. You do have the choice, however, to create a customized dashboard using the blank canvas dashboard. This way you can display only the information that matters most to you.

2. Shortcuts
Every Google Analytics reports you access has a menu with options to customize the report or create a shortcut to that report. For reports, you access regularly, creating shortcuts allows you to easily save that report’s settings for quick and efficient viewing every time you log into your Google Analytics account.
The settings you customize for a particular report are saved to your account when you create a shortcut and do not change unless you manually change them. This way you don’t have to reconfigure a report each time you open it.
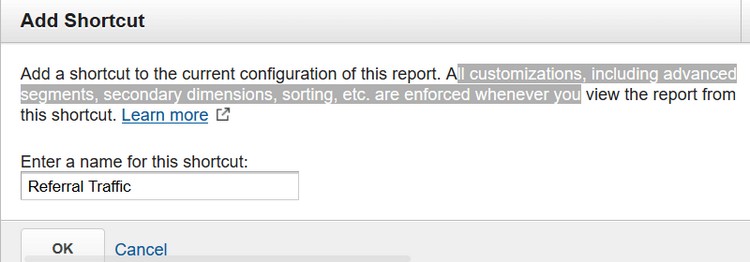
This menu also gives you the option to email your reports, add reports to your dashboard and download the report in various formats.
3. Intelligence Events
These reports allow you to track daily, weekly, or monthly events such as page views, clicks, visits, bounce rates, sales conversions, and much more.
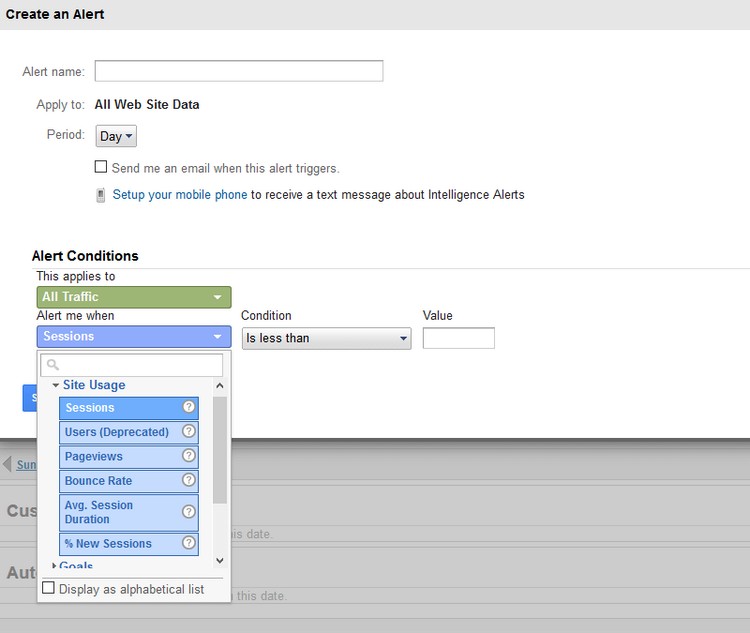
Automatic web alerts generate whenever Google Analytics detects a change in your website’s usage or traffic metrics. You also have the ability to create custom alerts for times when specific metrics deviates from their normal ranges or when the performance of your website simply changes.
4. Real Time
This report gives you a live report about visitors who are currently visiting your website. Specifically, there are 6 reports within Google Analytics’ Real Time: Overview, Locations, Traffic Sources, Content (or Screens, for Mobile App properties), Events, and Conversions. Each report displays the number of active users within specific time segments (the most recent 60 seconds and 30 minutes).
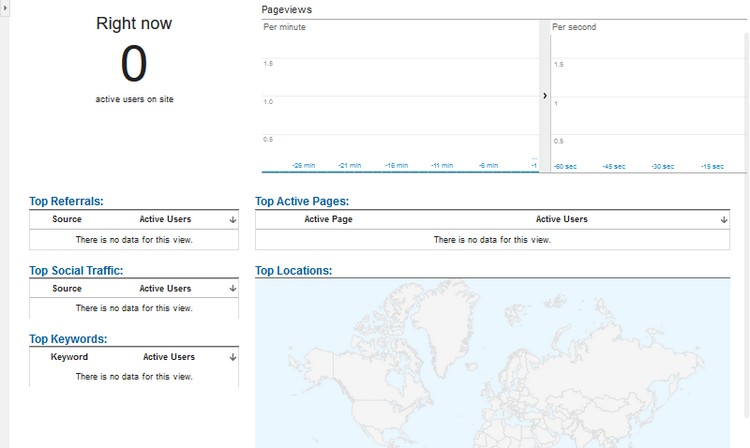
- Overview – This report will show you the pages users were previously on that prompted them to enter your website. Understanding what websites referred your visitors to your website can give insight into what visitors are looking for so you can engage them accordingly with your own products, services, or content.
- Locations – Using this report to see the geographic locations of your visitors and how many pages/screens were visited per each particular city will give you any idea of the demographics of your website visitors.
- Traffic Sources – A more in-depth look at referral pages, this report will show you if your visitors were directed to your website via a specific external website.
- Content/Screens – This report will show you what content on your website is the most popular by outlining how many visits per page have occurred in the last 30 minutes.
- Events – Things that can be tracked independently from web page loads (such as downloads, Flash embedded elements, and videos) are interactions tracked and viewed using this report.
- Conversions – This report will track conversions such as filling out a form, completing a purchase, or simply showing a high level of engagement with your site. If the goal of your website is to turn visitors into loyal customers, utilizing this report will be helpful.
5. Audience
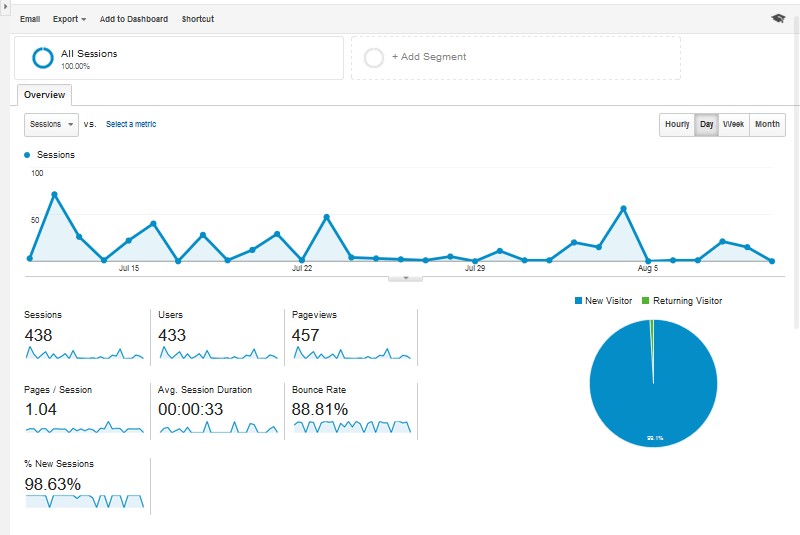
The Audience reports essentially tell you who your visitors are. With over a dozen audience reports offered including reports on demographics, location, and the devices visitors are using to browse your website, this category provides more than just basic traffic metrics.
6. Acquisition
Rather than telling you who your audience is, as the Audience reports do, Acquisition reports advise you as to where those people came from. They include a range of reports such as channels, referrals, paid search engine traffic, and organic search engine traffic. They also break down social media traffic so you can identify high-value networks and content, track on-site and off-site user interaction with your content, gain information on keywords being used to search and ultimately land on your website pages, and even link Google Adwords to your Google Analytics account.
Essentially, this report will show you how you acquire users, their behavior on your site after an acquisition, and their conversion patterns once on your website.

7. Behavior
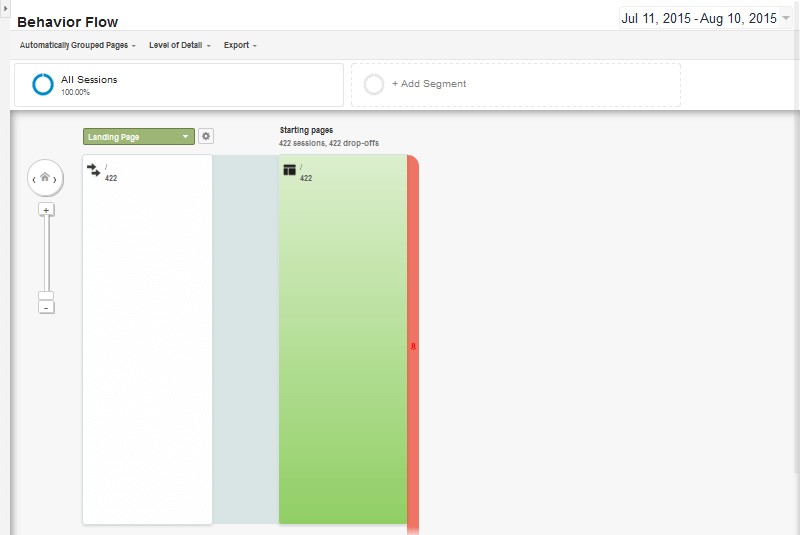
Once a visitor is on your website, the Behavior reports will give insight as to their interaction with your website content. These reports include information related to landing pages, exit pages, on-site searches, and site speed. You can also link Google Adsense into this section. Ultimately this report will provide a sense of what your most popular pages are and what pages visitors are navigating to afterward.
8. Conversions
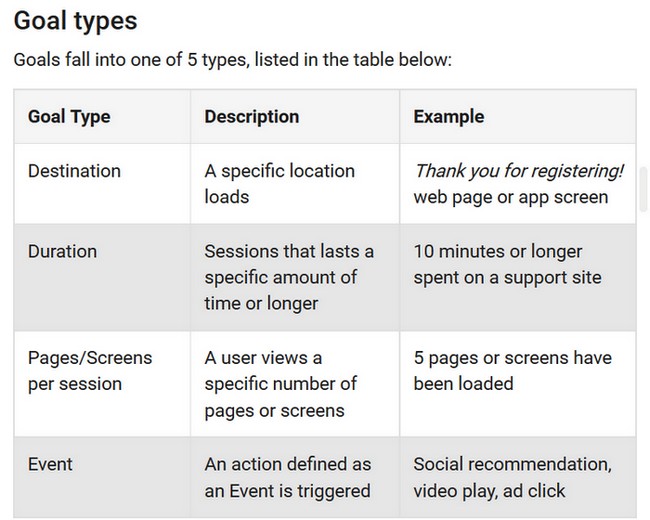
Conversion reports are geared towards online shop owners. The information available here includes product performance, sales performance, transactions, and the time it takes to complete a purchase. You can even create goals and monitor them in order to increase sales. After all, the objective of any business is to provide products or services to customers. Being knowledgeable about all aspects regarding those customers is what will make your WordPress website a success.
This is by no means an exhaustive list of Google Analytics’ features and what it can do to transform your WordPress website into one visitors eagerly search out and visit. However, having a basic grasp of even the most basic features can really boost your website’s traffic and steer you in the right direction to giving your readers what they really want.
Final Thoughts
Knowing what your website’s audience needs is important to your success. Understanding who your visitors are, where they are from, what they do once on your website, and so much more, will allow you to tailor your website to your visitors’ desires.
Taking advantage of such a powerful and helpful online program such as Google Analytics to analyze your WordPress website is one of the most important things you can do as a website owner to increase traffic to your site. Since the program is highly recommended in the WordPress community and comes at zero cost, there really is no excuse as to why you don’t install it onto your website right now.
What is your experience with Google Analytics? Have you discovered any “secret” features you would like to share? We would love to hear from you in the comments below!

